
Apache Iceberg metadata is powerful. It is also… not something you want to “read” manually during a debugging session.
If you’ve ever tried to understand what happened to a table under specific conditions (new
snapshots, manifests rewritten, data files added/removed, equality/position deletes appearing)
you’ve probably ended up bouncing between metadata.json, manifest lists, manifest files, and the
actual data/delete files. It works, but it’s slow, error-prone, and mentally expensive.
I built Iceberg Lens to make that workflow faster.
Iceberg Lens is a read-only, local-first desktop UI that turns Iceberg table metadata into an * interactive graph* with a structured Inspector panel (properties, lineage, changelog/summary). It’s designed for the “I’m debugging something right now” reality: quick navigation, clear structure, and less time manually reading the raw files.
Repo (installers available in GitHub Releases):
https://github.com/mmdemirbas/ice-lens
The pain: manual metadata parsing
A typical manual inspection loop looks like this:
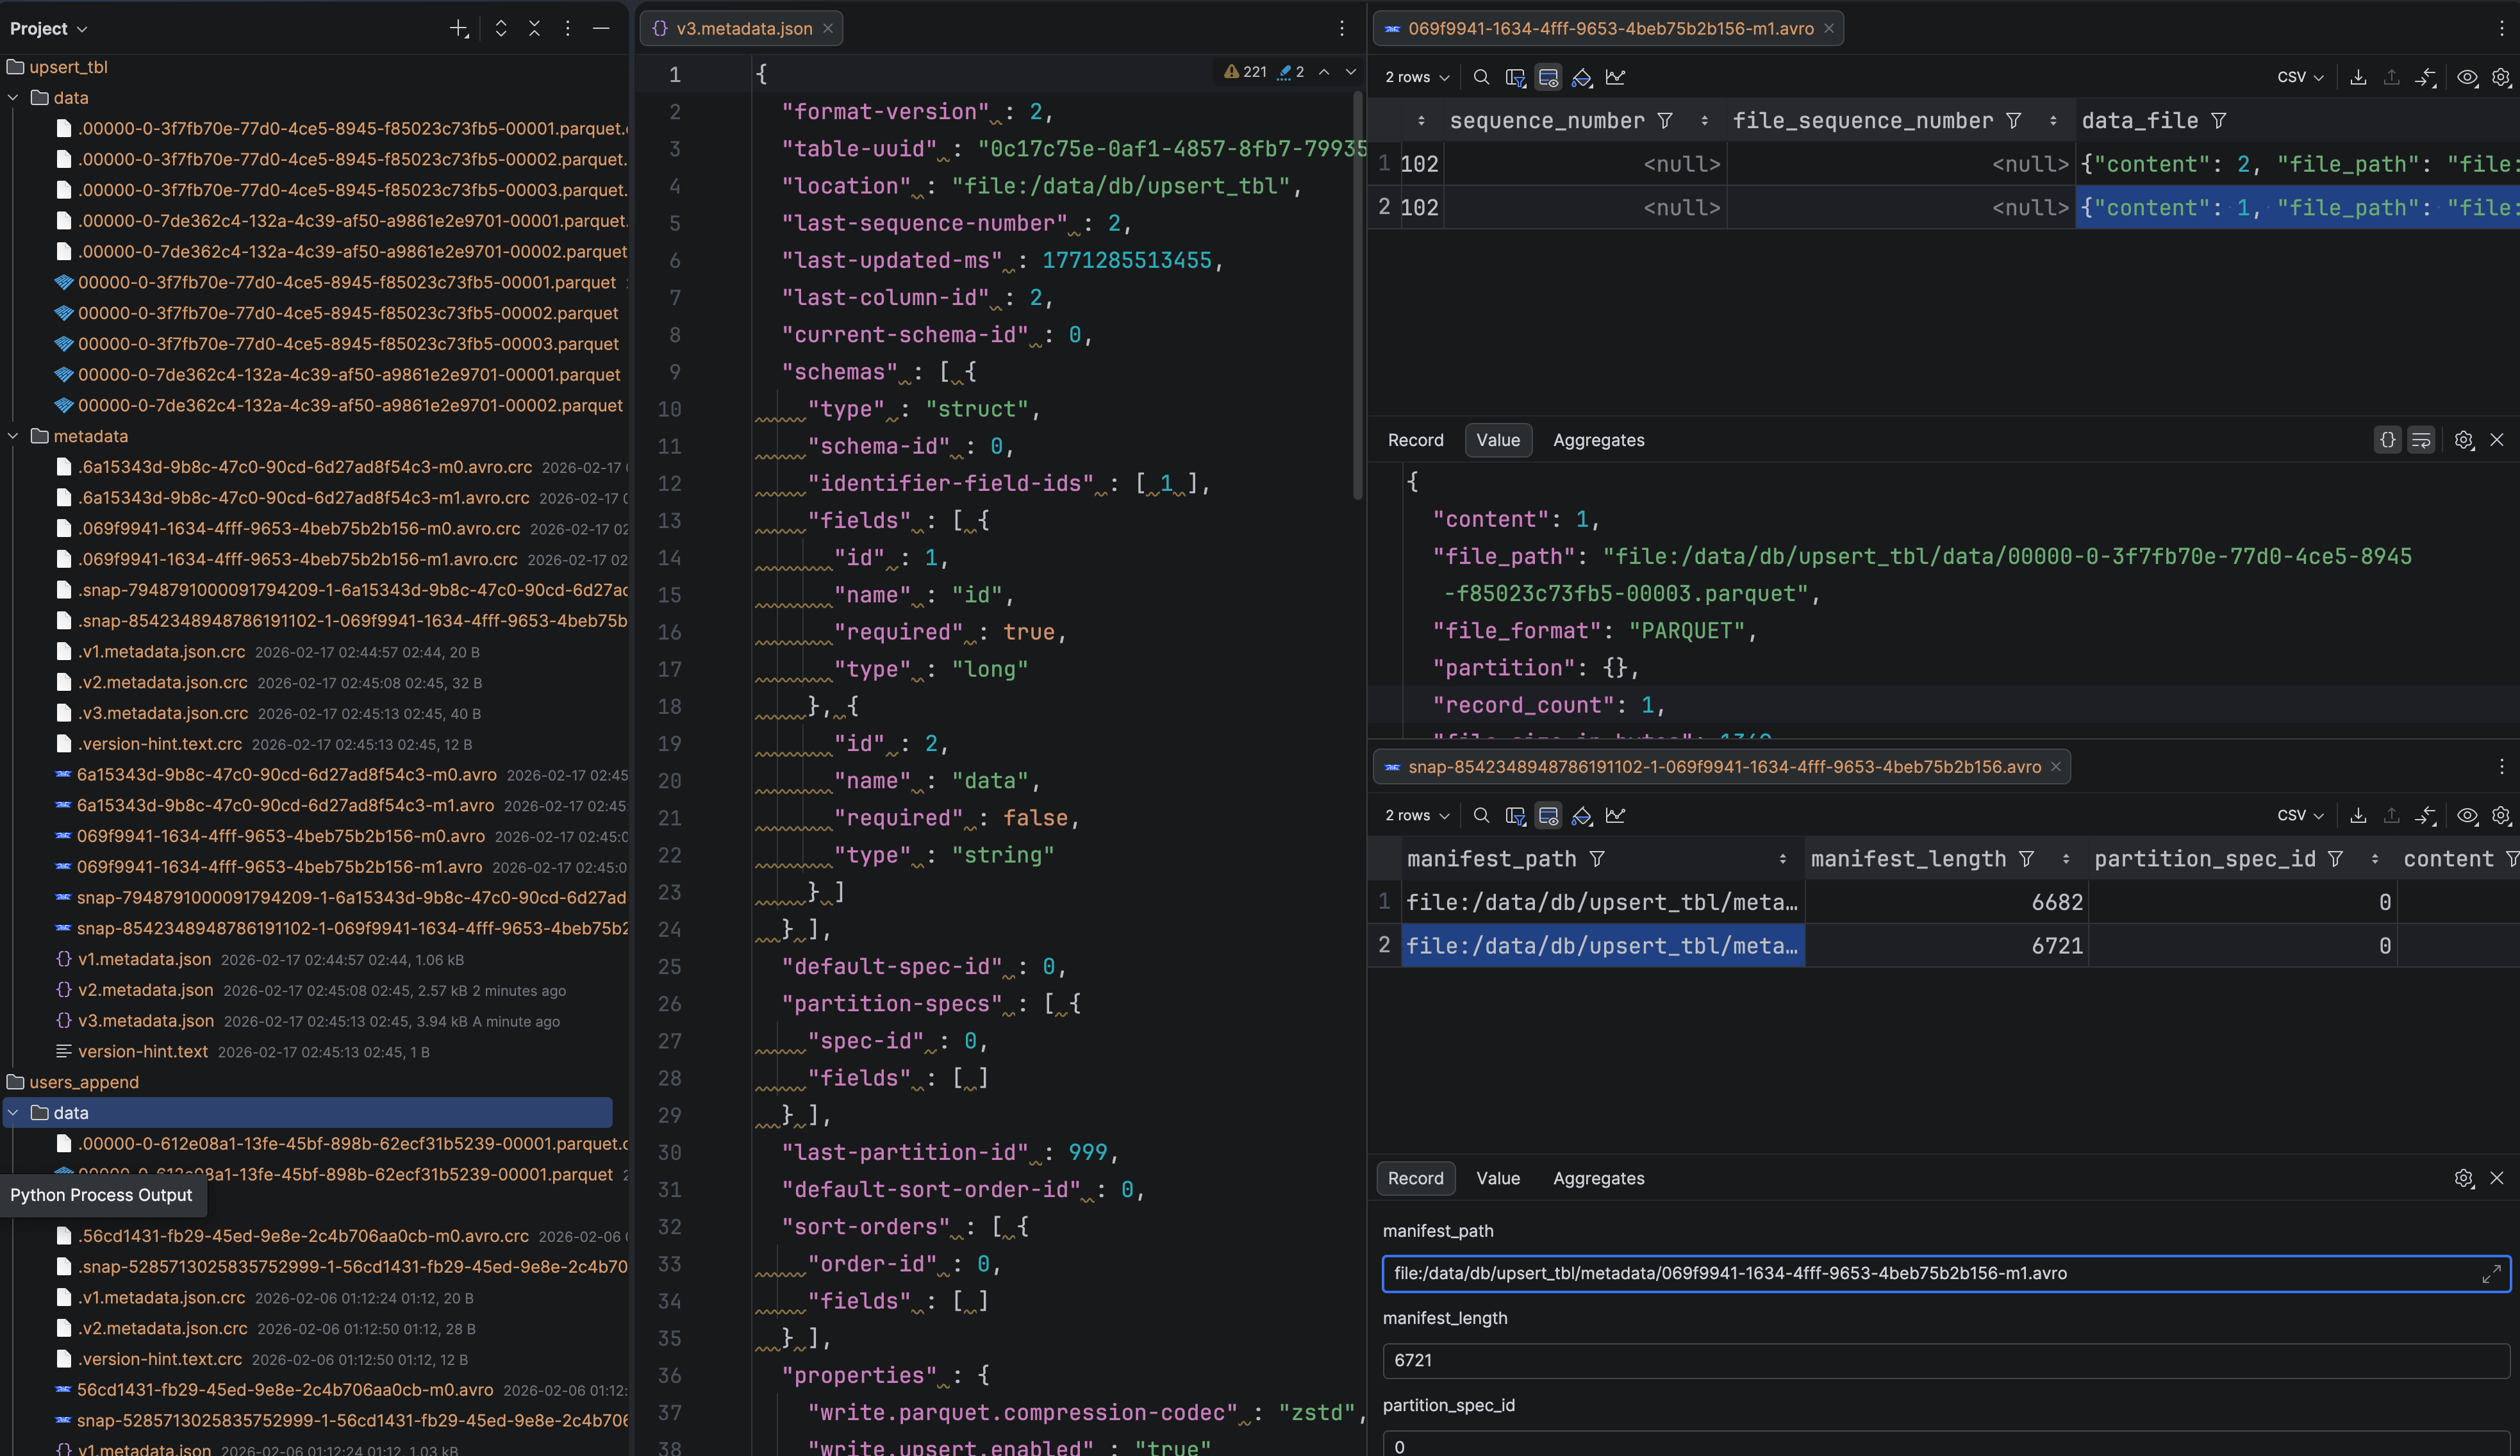
- Open table metadata (
metadata.json) and identify the current snapshot. - Follow snapshot references to the manifest list.
- Open the manifest list and find manifest files.
- Open individual manifest files and interpret entries:
- data files
- delete files (equality / position)
- Repeat for older snapshots or edge cases.
This is fine for learning Iceberg once. It’s not fine when you’re iterating on features, fixing bugs, or validating behavior across snapshots.
What Iceberg Lens does
Iceberg Lens focuses on one core goal: make the table’s structure obvious at a glance.
It helps you inspect:
- metadata
- snapshots
- manifests
- data files
- delete files (equality / position)
- sample rows (best-effort)
- changelogs at each level to track changes over time
The UI is built around two complementary views:
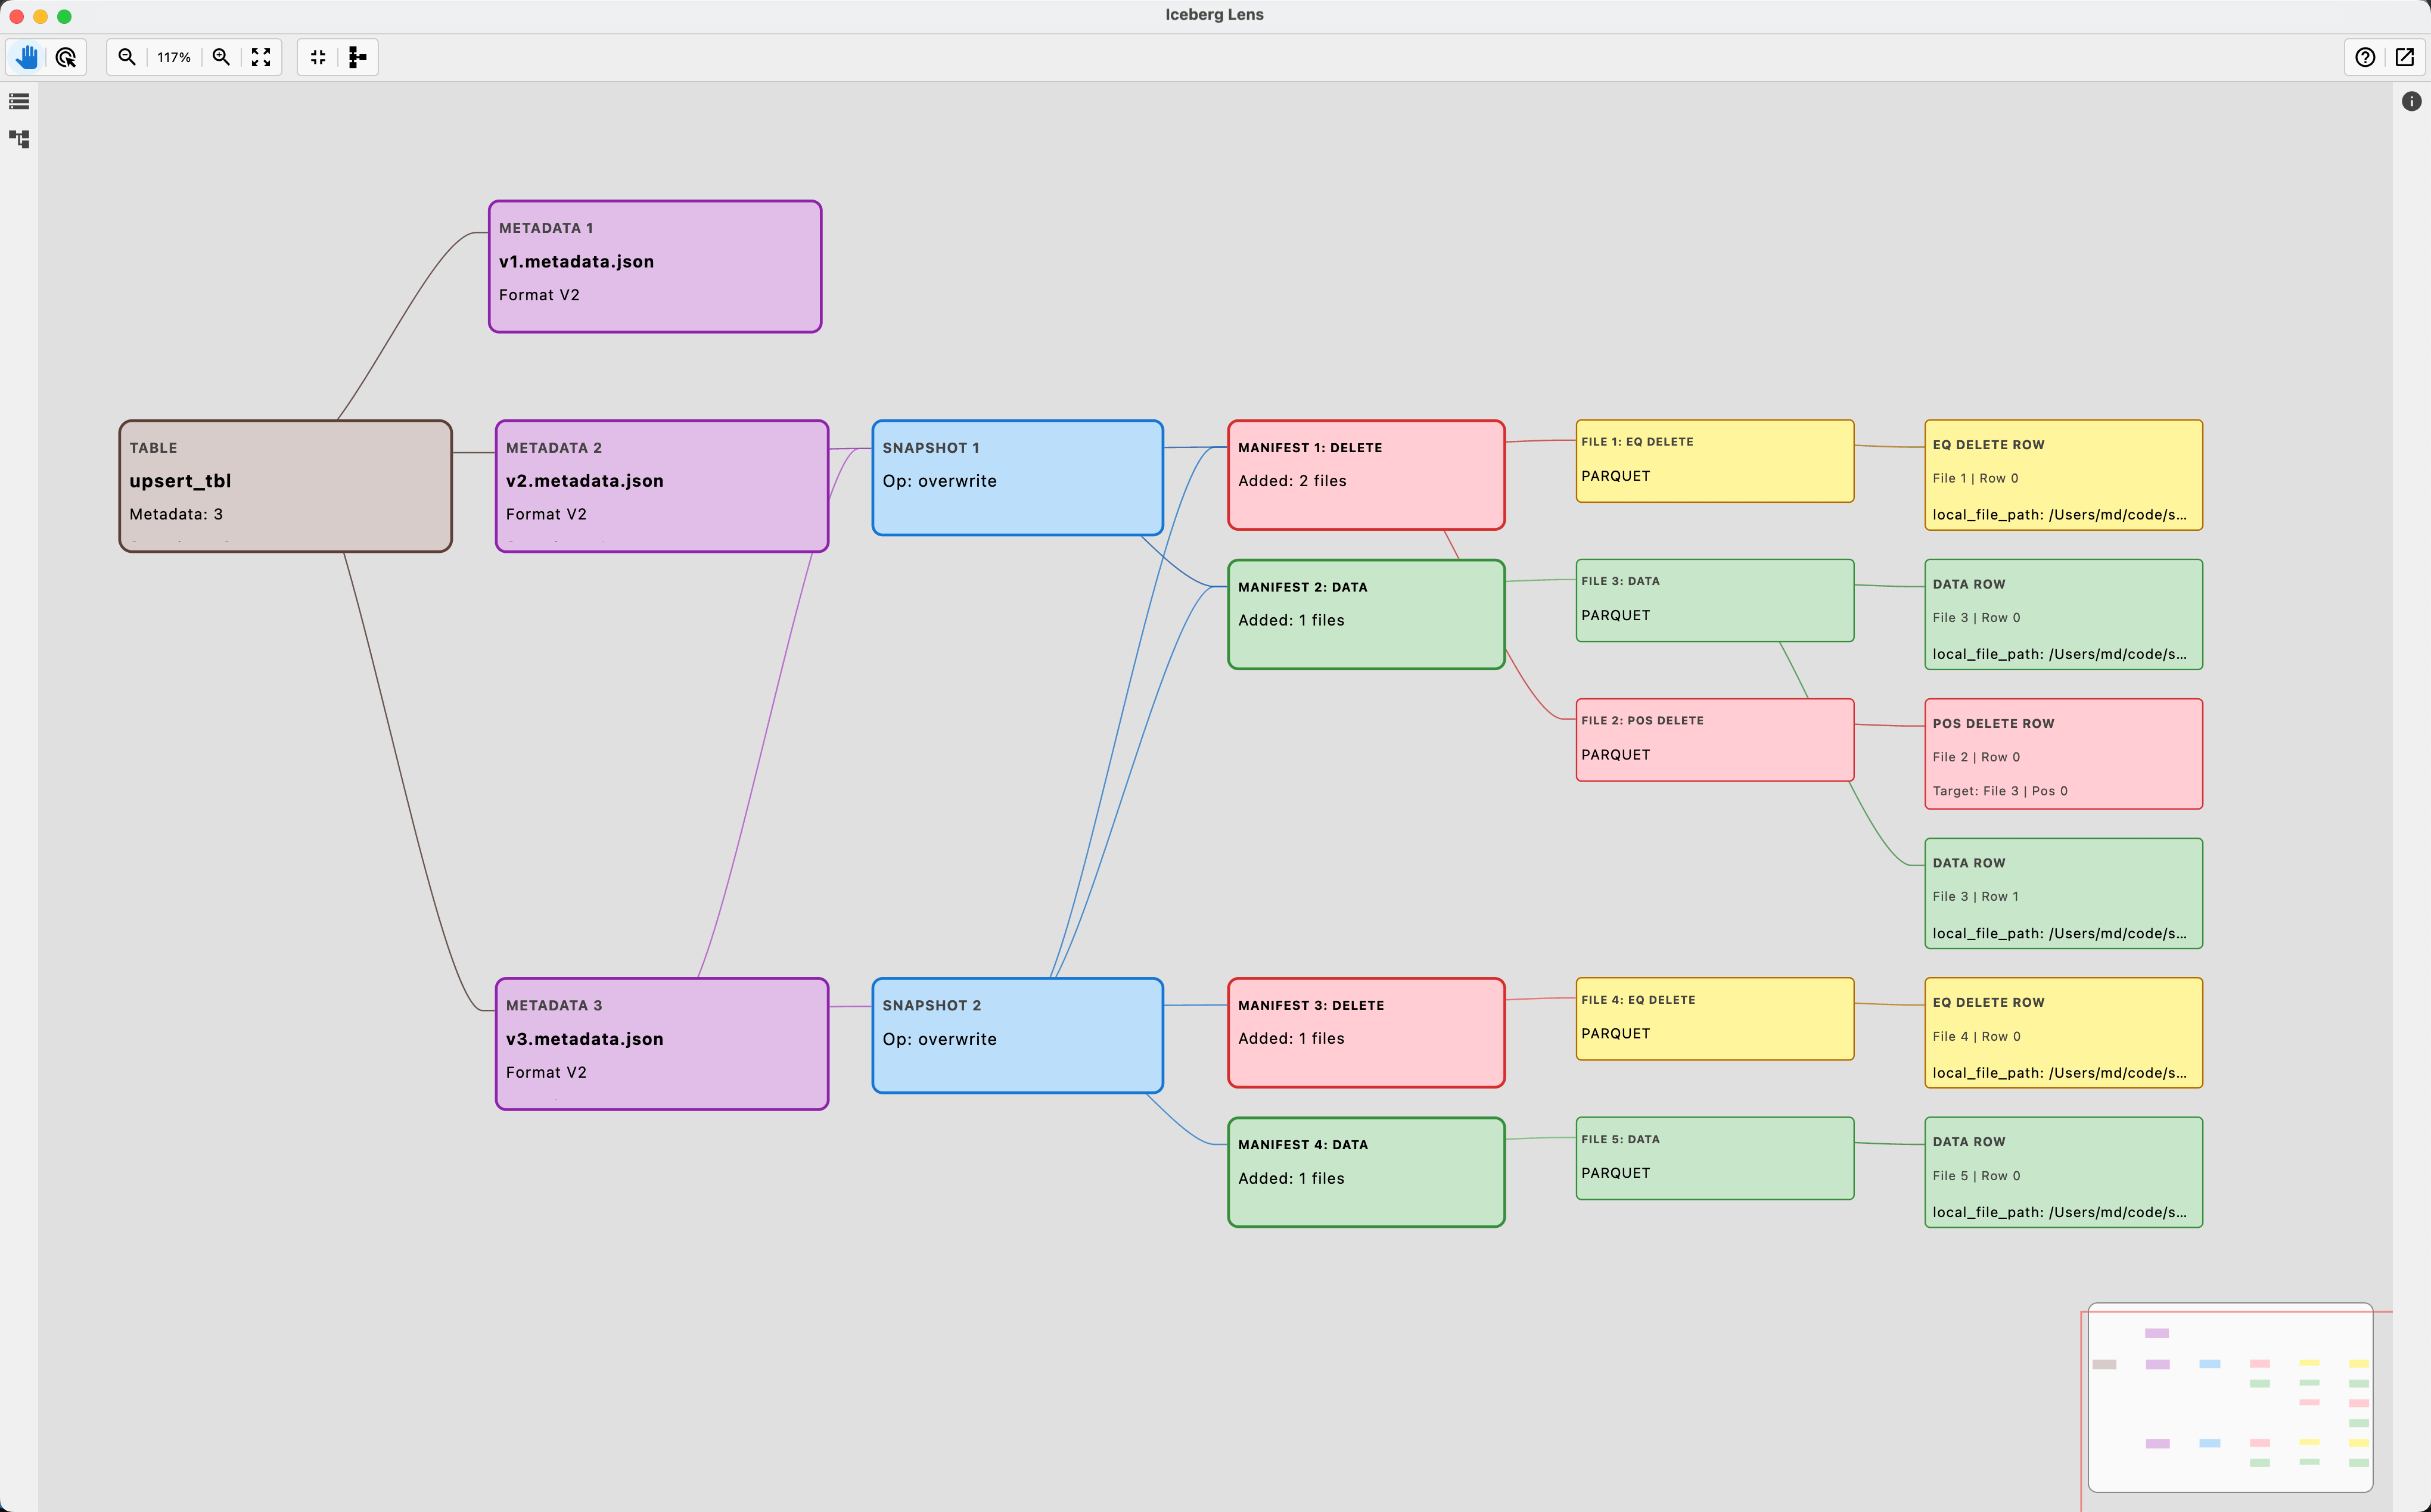
1) Graph view (structure & navigation)
You can visually traverse the table: metadata → snapshots → manifests → data files → data rows. Clicking nodes is how you navigate.
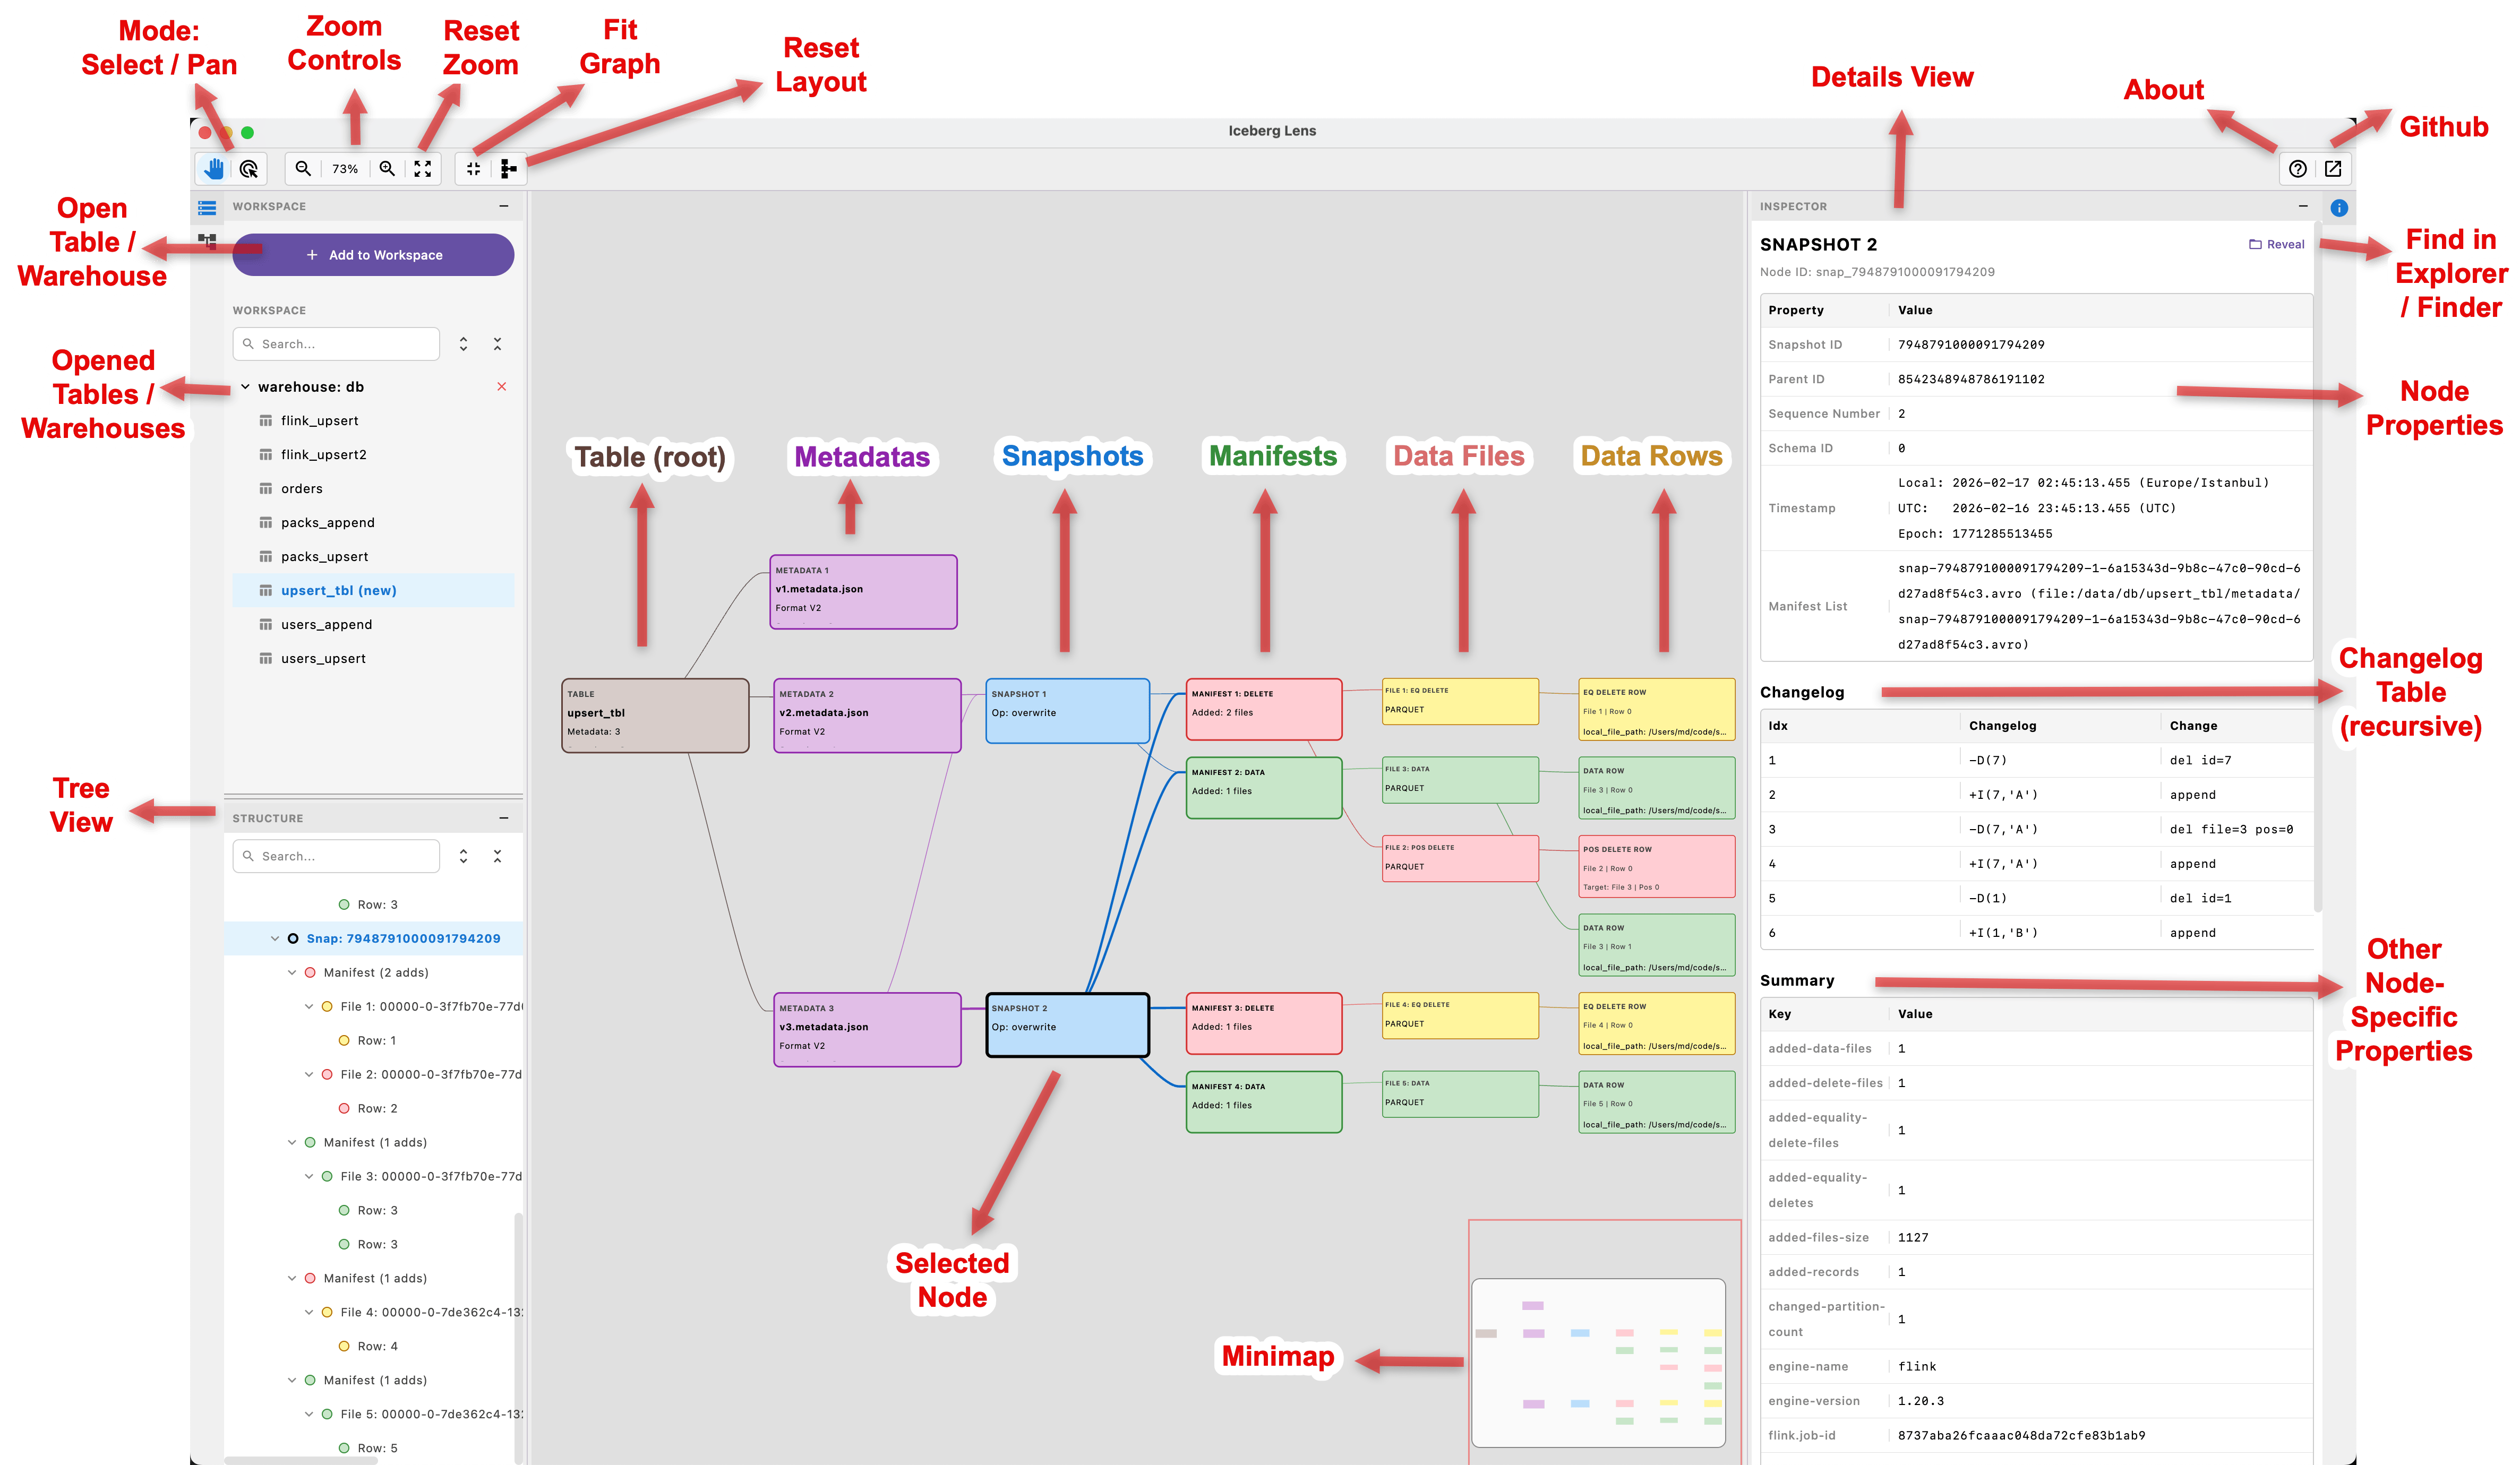
2) Inspector (details & lineage)
When you click a node, you get a structured detail view: properties, parent/child relations, and changelog/summary where relevant.
Instead of opening files and doing mental joins, you click, inspect, and move.
Why local-first and read-only
Iceberg Lens is currently local filesystem only and intentionally read-only.
That choice is practical:
- Debug sessions often happen on local environments.
- Read-only avoids risk and builds trust. You can explore without worrying about accidental mutations.
- No external catalogs or services are needed. It’s simple to adopt and quick to run.
Remote object stores and catalog integrations may come later if there’s demand, but the local-first approach is what makes it immediately useful for debugging.
Quick walkthrough
A common workflow looks like this:
- Add a table or warehouse to your Workspace.
- Select a table and start from the current snapshot.
- Walk down to manifest(s) and see which files they reference.
- Jump into delete files to validate equality/position-delete scenarios.
- Use the changelog tables to understand what changed across levels.
- Optionally inspect sample rows to confirm assumptions quickly.
Small features matter in these moments: “Fit Graph”, re-apply layout, opening multiple tables in the same workspace, and auto-reload when metadata changes.
Implementation notes
Iceberg Lens is built with Kotlin + Compose Desktop. The goal was a fast iteration loop with a native-feeling UI, so I could keep improving it as my Iceberg work evolves.
It started as a small “I need this for my debugging” project. After a few days of building, it became clearly useful enough to share publicly.
Current limitations
- Local filesystem only (no catalog integrations or remote object stores yet, but I could consider in the future )
- Reading sample rows will scan data files and will be slow on large tables.
What’s next (roadmap)

Here are directions that seem most valuable:
- Snapshot diff / compare (start file-level, then drill deeper later)
- Search + filters (partition, content type, file name)
- Export (graph / node details for sharing/debug docs)
- Layout options (different graph layouts)
- Performance improvements for large tables
- Potential IntelliJ IDEA plugin version
- Optional remote support (S3/HDFS/ADLS) if there is demand
If you try the tool, I’ll appreciate your feedback on:
What’s the #1 workflow you’d want supported next?
Try it / contribute
- Repo: https://github.com/mmdemirbas/ice-lens
- Installers are available in GitHub Releases.
- Feedback, issues, and feature requests are welcome.
If you’re an Iceberg developer, I’d especially love input on:
- Which node types/details you want surfaced by default
- What “snapshot diff” should mean in practice for your workflow
- What filters/search would save you the most time
Thank you for reading!